
Regression in Machine Learning: Definition and Examples of Different Models
Can you imagine trying to predict next year’s revenue without real information? Seems risky!
That’s the importance of regression with machine learning. Regression in machine learning is a mathematical description of the relations between the variables and allows us to predict occurrences accurately. Studies have shown that predictive analytics, including regression models, can improve a decision by 60%. In this paper, we are going to define regression in machine learning, explain its importance, and give examples of various regression models in machine learning.”
Table Of Content
What is Regression in Machine Learning?
How Do Regression Models Work?
What are the Different Types of Regression?
What is Linear Regression in ML?
Where is Regression Used in Real-World AI?
How to Turn Theory into Real-World AI Regression
Jaro Education – Guiding You Towards the Right Career Path
Conclusion
Frequently Asked Questions
What is Regression in Machine Learning?
In machine learning, regression is a type of supervised learning used to model continuous values. Regression in machine learning models gives a number, unlike classification, which estimates the discrete categories it is supposed to answer. Imagine that you are drawing a line through some points of a set of data to extrapolate where a new point would be. That is why it is termed “regression” in machine learning—it is concerned with discovering the relationship between variables to come up with a numerical forecast.
What is the difference between regression and classification?
The greatest difference between regression in machine learning and classification is the type of their output. In machine learning, regression predicts a continuous numerical value. The mistake is a label with a fixed set of regressors in machine learning. The output is for any range of numbers.
Examples: Estimate the price of a house (e.g., $350,000), the sales of a company (e.g., 1.5 million units), or the age of a person (e.g., 32.5 years).
The prediction of classification refers to a discrete category/class. The error is a label with a predetermined set.
Examples include allowing or blocking an email to be perceived as spam (spam/not spam), determining whether the given image is a picture of a dog or cat (dog/cat), and assessing the likelihood that a customer will not revisit (yes/no).
Briefly, if you are forecasting how much or how many, you are probably forecasting it using regression. When you are predicting the kind or which one you are engaging in, in classification.
How Do Regression Models Work?
Regression in machine learning models utilizes the relationship between an independent variable (the data available to you) and a dependent variable (the data you wish to predict). You will make a goal of devising a function (a so-called model) that will enable you to estimate the dependent variable value on behalf of the value of the independent variable.
What are the Different Types of Regression?
What is Linear Regression in ML?
One of the most basic and common algorithms in machine learning is linear regression in ML. It is a form of supervised learning, and the aim is to identify a linear equation that is most appropriate in the association between one or more so-called input variables (features) and a continuous output variable (the target).
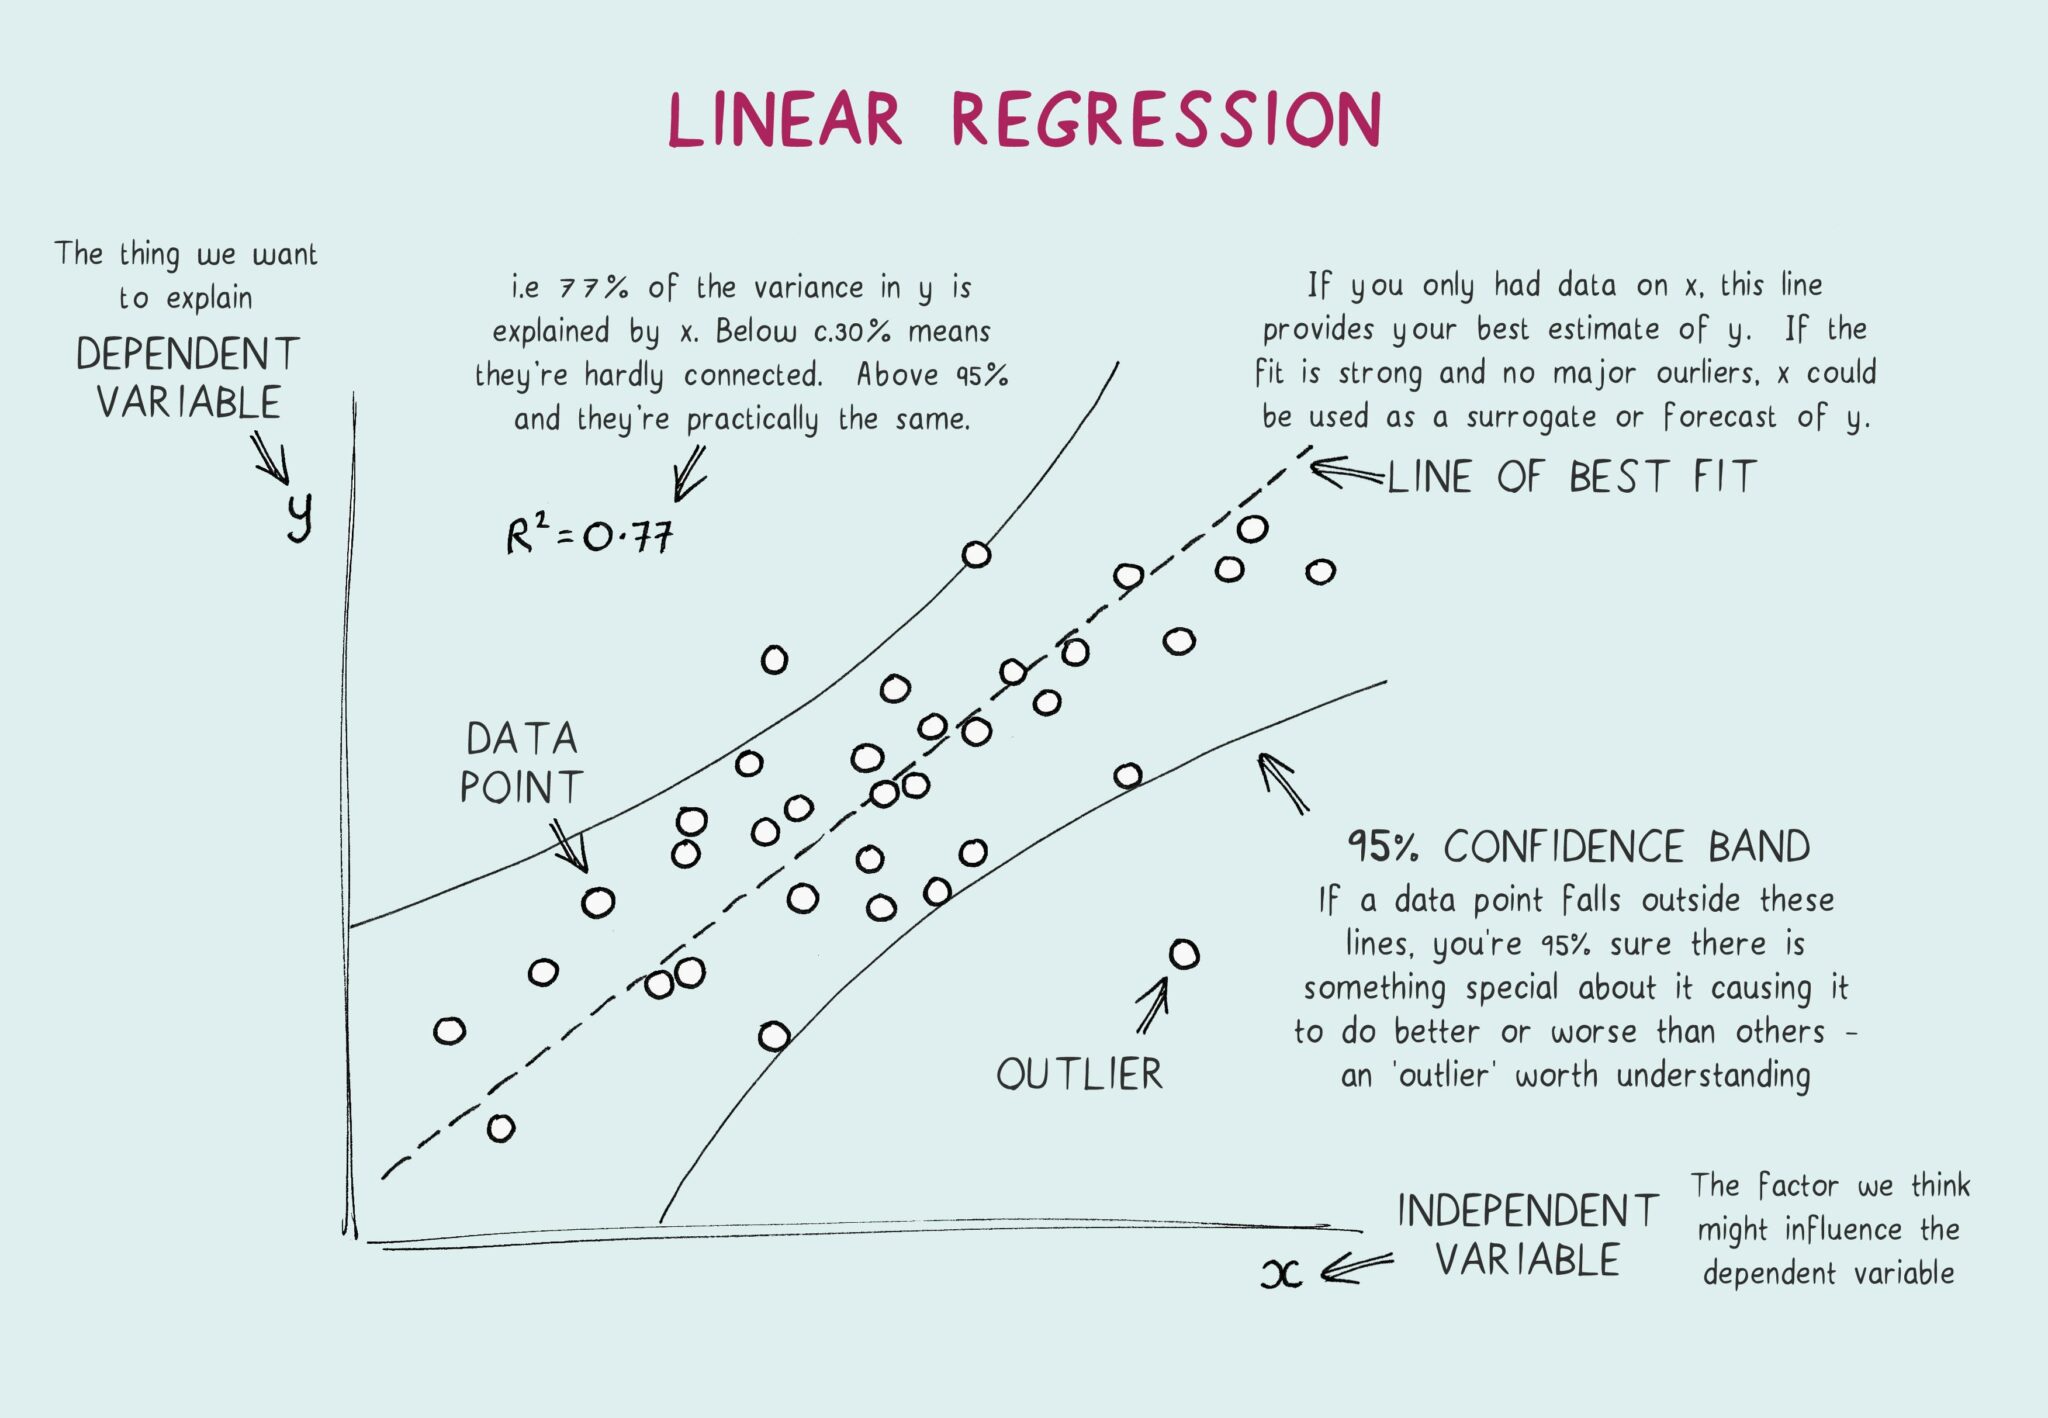
Main Idea: Fitting a Best-Fit Line
Consider a scatter plot of some data points, which indicates the relationship between two entities, such as the hours that you study and your exam score. The higher you study, the higher your score is likely to be. The task of linear regression in ML is to identify a single straight line that can be drawn through the center of all those points that reflects the general trend. This path is named the best-fit line or the regression line.
The model attempts this best-fit line by minimizing the distance between the line and all the data points. The line has the least total error of the entire data set, but it doesn’t take the perfect values of each point.
So, How Does It Work?
The model of simple linear regression in ML is founded on a well-known algebraic equation:
y=mx+b
- y is the predicted value (e.g., the exam score).
- x is the input value (e.g., number of hours studied).
- m is the slope of the line, representing how much y changes for a one-unit change in x.
- b is the y-intercept, the point where the line crosses the y-axis.
In machine learning, algorithms learn optimal ‘m’ values from training data. These values then enable the model to make predictions. For instance, inputting ‘5’ for ‘x’ would allow the model to calculate your exam score (‘y) based on the learned m ‘ and ‘b’ values.
When to use it?
You should consider using linear regression in ML if you believe the variables are linearly related. It is simple, quick, and highly interpretable, so it is an excellent starting point for numerous predictive tasks, such as sales forecasting, predicting the price of a house from its size, or estimating a person’s weight from their height.
There is Nothing Too Creatively Plotted About Data: Linear regression is best when the data you are working with is not too creatively plotted. In case your variables’ relationship is a curve, a jagged line shape, or a sharp point, then the more advanced model, such as polynomial regression, will be necessary. The linear regression in ML does not work well with data sets that appear to be chaotic clouds or flawless curves.
You Need a Fast Backdrop: There may be more complicated models out there that could theoretically outperform, but in general, it is a prudent practice to start with linear regression in ML. It has a short training time, which can be used as a reference point. Unless a higher specification model performs much better than your simple linear regression model in machine learning, you may simply want to use the simpler model that is easier to understand.
Concisely, when searching for a simple, fast, and explainable model of a problem having a clear and linear trend, linear regression is superb.
Where is Regression Used in Real-World AI?
Regression in all places! Regression models in machine learning are a favorite tool of AI since a lot of real-world problems entail predicting a numerical outcome. The following are some of the most ubiquitous and interesting locales in which you can come across regression in machine learning in action.
House Price Prediction
This is vintage regression in machine learning. A real estate firm does not simply estimate the value of a house; there is an estimation, and it is based on information. A regression model in machine learning is input with a lot of information on a house:
- Area (square footage)
- Number of bedrooms and bathrooms
- Site (neighborhood, city)
- Year built
The model learns the influence these factors, or features, will have on the ultimate price of sale. Having been trained on thousands of previous sales, it may tell the price of a new house surprisingly well. This assists the realtors in setting a reasonable price and assists buyers in knowing what they can expect.
Sales Forecasting
In any business, it is important to know what they will be selling in the future. One of the applications would be in a retail store where sales in the coming holiday season can be projected using a regression model in machine learning. Analysis by the model may include:
- Past sales records of the past years
- Existing/Current expenditure on advertising
- Economic trends
- Season (seasonality)
Such numbers can be crunched with the help of the regression in the machine learning model, which can calculate a given sales figure. This assists the business in planning its stock, controlling its supply chain, and distributing its advertising budget more efficiently so that they do not end up with excess or running short.
Guessing the Age of a Person by a Photo of Him/Her
This application is more sophisticated and is commonly used in computer vision. Take that app that manages to guess exactly how old you are based on a photo of you; chances are, it is interfacing with some serious regression model in machine learning. It is not only identifying one feature, but the model is trained on a massive number of known-aged faces. It is taught to identify slight changes that come with advancing age, including:
- Fine lines and wrinkles
- Skin color and texture
- Bone modelling changes
- Hair coloring, hair density
The model puts you in a continuous numerical distribution of age—such as 32 or 45—rather than an immiscible distribution as in, say, your 20s or 30s. This technology is used in age-gated content to build customized user experiences, to name just a few.
How to Turn Theory into Real-World AI Regression
Classroom Ideas to Practical Answers
Most data science courses help you learn the theory behind an algorithm, such as regression in machine learning; however, the Post Graduate Certificate Programme in Applied Data Science & AI at IIT Roorkee takes it one step further. This course will help fill the gap between theoretical knowledge in the textbook and practical use. It is not only about how to learn the equation of a best-fit line, but more about how one can use the best-fit line to derive complicated real-world problems.
As an illustration, you will study the theory behind linear regression in ML; this is then followed by an instant application in the form of generating a model to predict house prices using actual data sets. You would proceed to more complex implementations of regression models to predict sales of a company or even customer churn. This practical focus, where the best of IIT Roorkee research and faculty are your teachers, means you know more than what these models are—you know how to build, train, and deploy them.
Jaro Education – Guiding You Towards the Right Career Path
At Jaro Education, we get that making the right career choice can impact the rest of your life. That’s why our expert career counseling services and guidance services help you identify your strengths, positions that suit you, and make the right decisions with confidence. Get personalized advice, industry insights, proven methodologies for successful outcomes at all levels, and we will support you through a process where you do not choose a career, you choose the career that is right for you.
Conclusion
In machine learning, regression is a general method of predicting continuous variables given some input called features. It is applied in various practical problems in real life, such as predicting prices and analysis of trends and risks. Regression in machine learning is simple and effective in interpreting data relationships.
Simple Linear Regression vs. Multiple Linear Regression
The variance comes down to the number of independent variables that are applied in the prediction of a dependent variable.
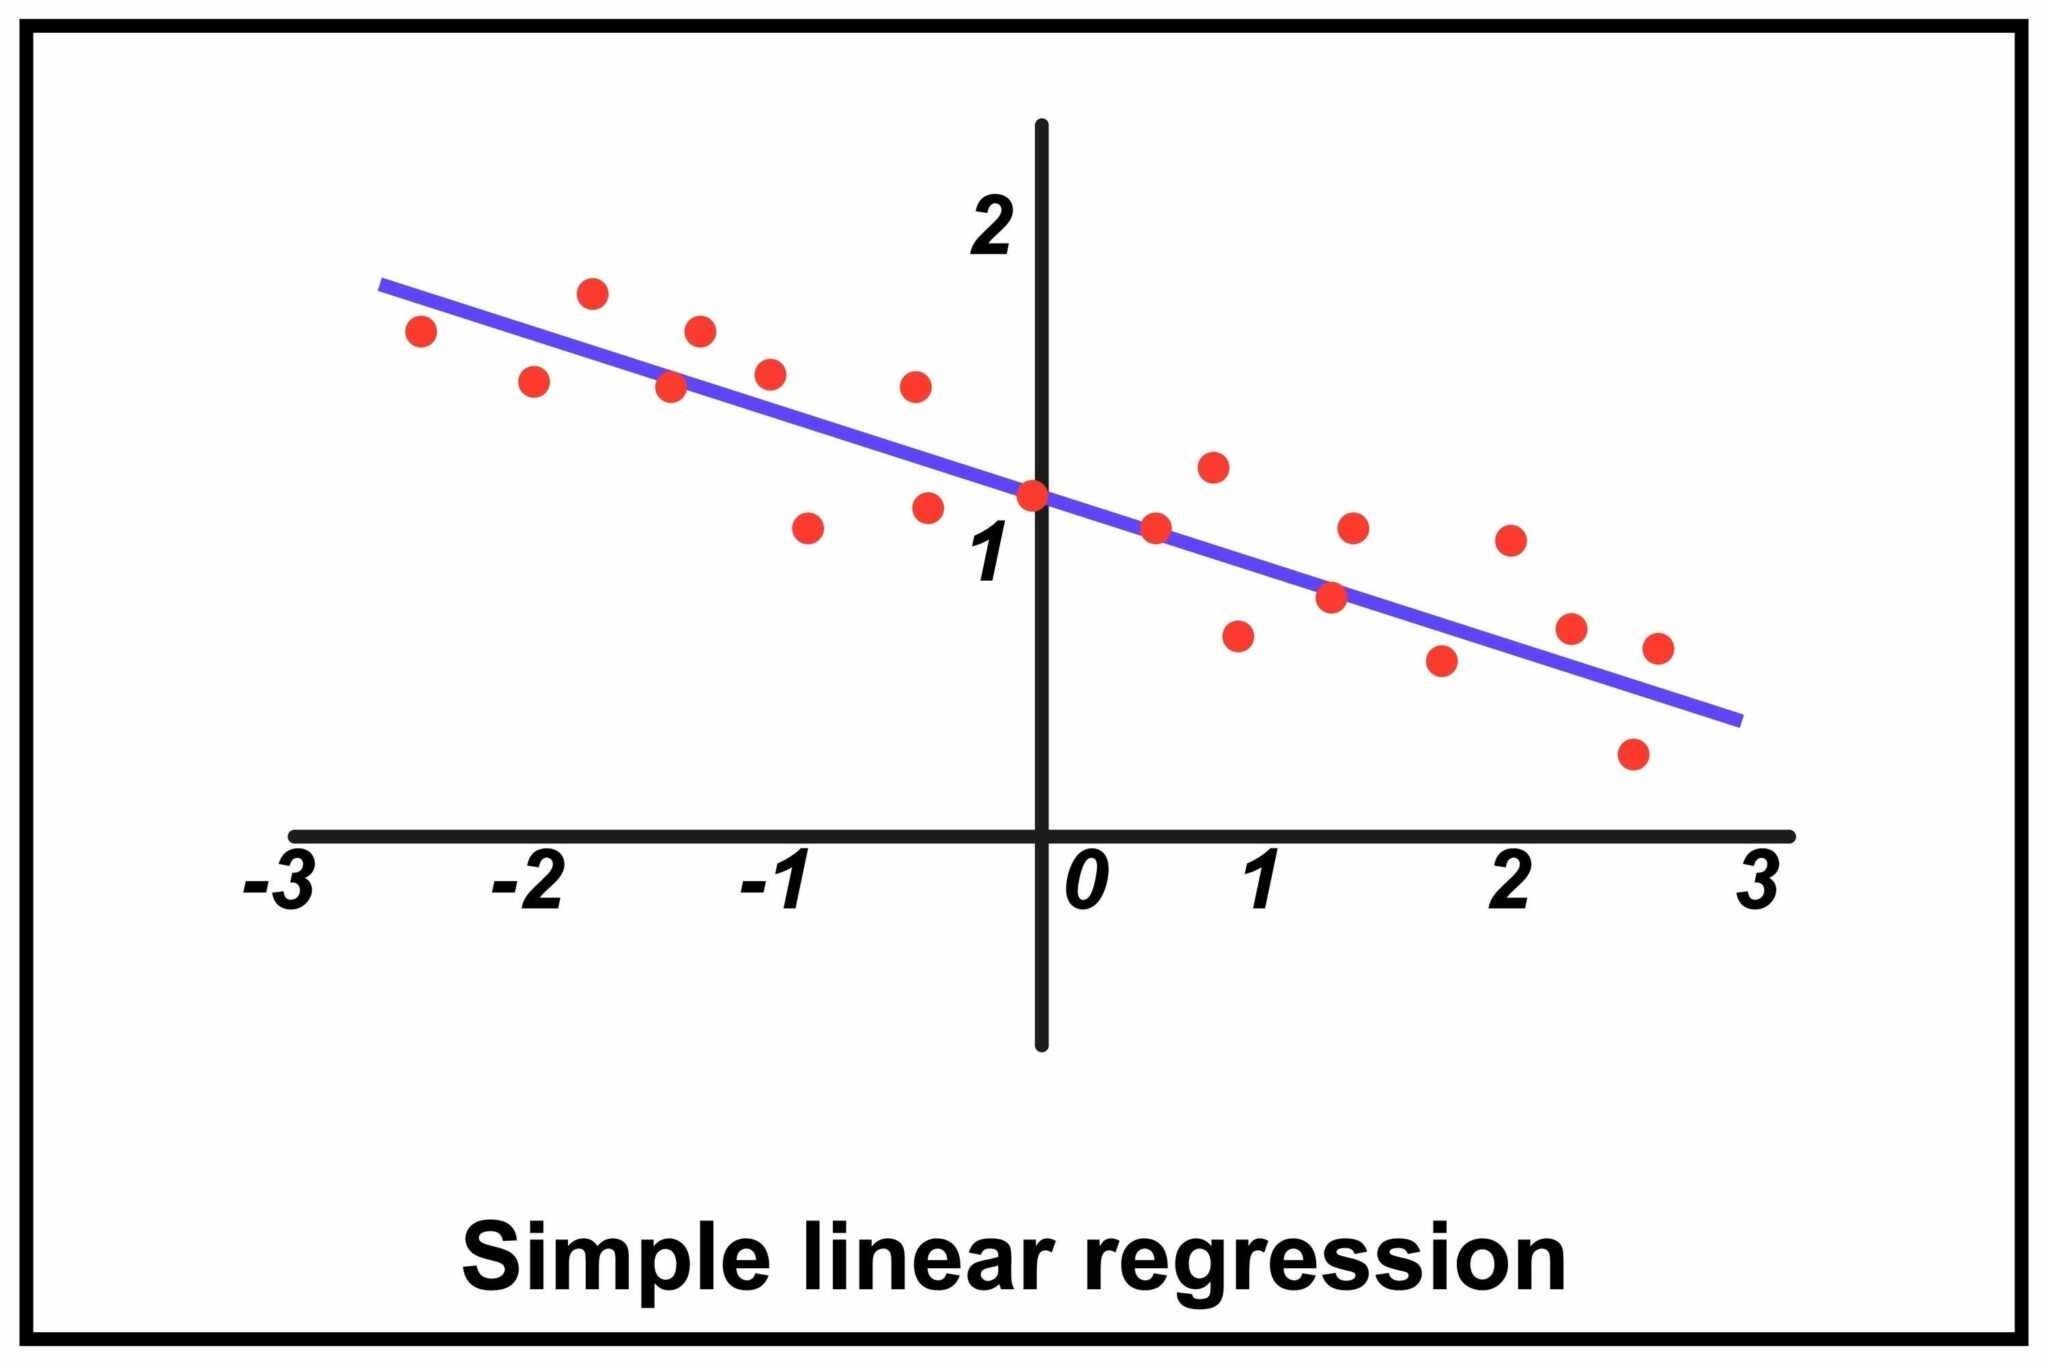
Simple linear regression is characterized by only one independent variable. To give an example, the score of a student on a test was achieved by estimating it based on the time devoted to studying. The connection is graphically depicted based on a straight line.
Multiple linear regression relies on two or more of the independent variables. As an example, the estimation of one of the test scores depends on the number of hours that the student was able to study, the attendance rate, and the previous GPA. This produces a more complex model, though it can give a more accurate predictio
Manifest a non-linear trend in the relationship between your independent and dependent variables, that is, the data points do not line up in a straight line and thus do not fit well when trying to fit a straight line, but instead assume a curvy-like path. Linear regression most appropriately fits data that has a straight line representation.
An example would be when you are driving a car and you are graphing its velocity against time, and you notice that it goes around a curve as opposed to a straight line. In the given case, a polynomial regression would be a better fit since it would end up drawing a curved line. Linear regression, in turn, would fit much worse and would hardly prove effective in producing correct predictions.
Ridge and Lasso regression are regularization methods that are employed to curb overfitting of a model. Overfitting: a model that learns too much of the data (i.e., noise) will be learned, instead of the model performing poorly when applied to new, unfamiliar data.
Both procedures operate by introducing a penalty term to the loss function of the model so that the coefficients of the model do not increase to very high values.
In Ridge Regression (L2 regularization), a penalty is added, the square of the size of the coefficients. This drives the coefficients Rep towards zero, but never directly to zero. Not all features are removed in the model, but their effect will be mitigated.
Lasso Regression (L1 regularization) introduces the penalty that depends on the absolute value of the coefficients. The most essential thing is that Lasso can contract the coefficients of less significant features down to the value of zero. Not only does this avoid overfitting, but it also does automatic feature selection, resulting in a simpler and easier-to-interpret model
No, logistic regression is not a regression algorithm of any sort, but is a classification algorithm with that name. It is applied to forecast a categorical variable (e.g., the value is to be either yes or no, spam or not spam).
The name is explained by the fact that it applies a linear regression-style method to estimate a probability (a continuous outcome between 0 and 1). It, however, then applies a threshold to categorize that probability into a finite group. An example is that, when the likelihood of a transaction being fraudulent is set at 0.75, the model would label it as such or a fraudulent transaction.
Although linear regression can be applied to time series data, it is regularly ineffective since it does not consider the time factor and the association that exists in the time series data.
Time series forecasting is usually done on specialized models:
- ARIMA (Autoregressive Integrated Moving Average): An older model of statistics, and it is one of the most efficient to capture the trends and seasonality of a time series.
- Prophet: A forecasting library created by Facebook that is wonderful for taking care of data that has large seasonality and missing data points. ARIMA is usually more complex to use.
- Recurrent Neural Networks (RNNs) and LSTMs are deep learning models, extremely effective with nonlinear time series data when you have plenty of data.

