
Unlock the Most Exciting Data Science Interview Questions and Answers
 Source: techbootcamps.utexas.edu
Table Of Content
10 Qualitative Data Science Interview Questions and Answers
20 Quantitative Data Science Questions and Answers
Jaro Education: Data Science Interview Questions and Answers, Careers and More
Final Thoughts
Frequently Asked Questions
10 Qualitative Data Science Interview Questions and Answers
The first endeavor is to crack how to bring your personality to the table. This enables the employer to understand how your character can add value to their team and projects. Here are 10 data science interview questions and answers that would help companies understand you better:
1. Have you ever had to explain a complex data science concept to someone with a non-technical background?
The first thing I would prioritize is simple communication. In my internship, I worked closely with the product marketing team who were marketing graduates. I avoided jargon and used day-to-day examples to explain my concepts. I also used graphs and illustrations to explain my projects with current trends.
2. Have you ever gotten into disagreements with your team? How do you solve them?
In college, my teammates and I worked on customer churn predictions. There was a disagreement about which features to highlight. I facilitated a discussion to prove why a feature deserves to be highlighted with data-backed explanations. This created an open environment and we came up with solutions together.
3. Have you led data projects? Tell us more about it!
I’ve led multiple projects in college. It was challenging to ensure everyone was on the same page, but I learned how to set goals, check in regularly for updates, and manage in real time. I assigned roles based on each person’s strengths, and we won the best project award.
4. How do you deal with conflict, especially when collaboration is needed?
Opening the floor for honest discussion goes a long way. In one group project, teammates wanted different approaches to data complexity. I organized a meeting to align priorities and proposed phased projects that incorporated both approaches.
5. How do you respond to constructive feedback on your work?
During a peer review of my data visualization project, I received feedback that my dashboard was too cluttered. I took it seriously, asked clarifying questions, and simplified the design to improve clarity.
6. How do you manage multiple priorities on a tight deadline?
When I had to work on a team data science project and a presentation simultaneously, I delegated tasks and created a priority matrix to manage both effectively.
7. How do you prioritize ethics in a data project?
I’m aware of biases in data science. During a college project on customer segmentation, I noticed bias based on our group’s preferences. I flagged it and we implemented additional processes to remove the bias.
8. How has college prepared you for a data scientist role?
College gave me a solid foundation in mathematics, statistics and programming. Coursework and projects prepared me for data analysis and visualization while developing my problem-solving abilities.
9. Why are you a good fit for this company?
I bring both qualitative and quantitative attributes. My experiences have prepared me for leadership roles – I’ve led multiple award-winning projects and can leverage my skills to drive impactful insights.
10. What challenges did you face in your most recent project and how did you learn from it?
My team worked on a project with significant data gaps. We applied data cleaning techniques (mean, median, mode and outlier treatments) to clean it up. This taught me to learn quickly and pay attention to detail.
Things to Remember
- Include plenty of life experiences and examples in your answers
- Mention a challenge, a learning moment and a solution you contributed to
- Highlight your personality – be open, curious and confident
20 Quantitative Data Science Questions and Answers
Employers would want to understand your knowledge of data science. This means you need to prep for data science Python interview questions too. Brush up on the basics and remember key concepts!
1. Data Science Python Interview Question: How do you clean up large datasets?
Answer: I use Pandas extensively to organize large data sets. I use drop and fill to handle missing values and remove duplicates easily with this. It has helped me understand how to standardize data sets with value sorting and string methods. I also find that something as simple as renaming columns can improve clarity. I am also actively learning correction methods for outlier values.
2. Data Science Python Interview Question: Describe how you handle customer segmentation models.
Answer: Python has clustering algorithms like K-means for efficient data handling. K-means helps group customers into different segments based on characteristics like geography or gender. Then I use data visualization techniques like graphs to communicate the results.
3. Data Science Python Interview Question: Explain how Python helps with the bias-variance tradeoff.
Answer: Every data science model is a balancing act between its simple components, aka the bias, and the complex ones, aka the variance. This results in underfitting or overfitting. Python comes in handy for that balance because it evaluates model performance with techniques like cross-validations in scikit-learn. It also uses regularization methods like L1 and L2 and tunes hyperparameters through tools like GridSearch to optimize balance.
4. Data Science Python Interview Question: How do you reduce bias in data sets?
Answer: Data models often have high biases, but Python is extremely helpful. I add more features to increase model complexity and eliminate base biases. I also switch to a more flexible algorithm such as Random Forest. Hyperparameters can be adjusted through scikit-learn. One example would be decreasing regularization strength in a project predicting grocery prices. By lowering the alpha parameter in Ridge regression, I can enable the model to capture correlations between features better, thereby reducing bias.
5. Data Science Python Interview Question: How do you use data visualization techniques?
Answer: Libraries like Matplotlib and Seaborn are great for data visualization tools like scatter plots and heatmaps. For example, I’d use a heatmap to analyze correlations in a customer segmentation model, using libraries like Matplotlib and Seaborn to create plots such as histograms, scatter plots, and heatmaps.
6. Data Science Python Interview Question: What is high-dimensional data in ML and how does Python come in handy?
Answer: I find the curse of dimensionality interesting because of how many little features can change the outcome. This added challenge makes it more interesting! I use techniques like Principal Component Analysis (PCA) for dimensionality reduction and the many features in scikit-learn to identify relevant features. This makes the model’s performance and interpretability higher, more efficient, and accurate.
7. Data Science Python Interview Question: How would you handle a class imbalance in a multi-class classification problem using Python?
Answer: Techniques like SMOTE, or Synthetic Minority Over-sampling Technique, to oversample minority classes, or scikit-learn components like class weights in the model. F1-score and confusion matrix also help ensure balanced performance across classes. For example, in a study of predicting summer fashion, if the data sets show 90% of trends from one city and only 10% from another, there is an imbalance. I would use SMOTE to oversample the latter classes or use class weights to give more importance to the minority dataset during model training so there are balanced predictions across both species.
8. Data Science Python Interview Question: How is logistic regression done?
Logistic regression is used to predict the binary outcome of variables. You would use the sigmoid function to map the values into probable results. A code example would be:
from sklearn.linear_model import LogisticRegression
from sklearn.model_selection import train_test_split
from sklearn.metrics import accuracy_score

# Example Data
X = [[1], [2], [3], [4], [5]]  # Feature
y = [0, 0, 0, 1, 1]  # Binary Labels

# Split Data
X_train, X_test, y_train, y_test = train_test_split(X, y, test_size=0.2)

# Model Training
model = LogisticRegression()
model.fit(X_train, y_train)

# Predictions
predictions = model.predict(X_test)
print("Accuracy:", accuracy_score(y_test, predictions))
9. Data Science Python Interview Question: Explain how you would build a random forest model.
Here are the steps to build a random forest model:
- Clean and pre-process the available datasets. You can split it into training and testing sets.
- Use sklearn features such as RandomForestClassifier or RandomForestRegressor to train the model.
- Tune the parameters for optimal performance with features like n_estimators, max_depth, etc.
- Test accuracy using metrics like accuracy or RMSE. Example Code:
from sklearn.ensemble import RandomForestClassifier
from sklearn.model_selection import train_test_split
from sklearn.metrics import accuracy_score

# Example Data
X, y = [[1, 2], [3, 4], [5, 6], [7, 8]], [0, 0, 1, 1]
X_train, X_test, y_train, y_test = train_test_split(X, y, test_size=0.25)

# Train Model
rf = RandomForestClassifier(n_estimators=100, random_state=42)
rf.fit(X_train, y_train)

# Predict and Evaluate
y_pred = rf.predict(X_test)
print("Accuracy:", accuracy_score(y_test, y_pred))
10. Data Science Python Interview Question: How do you avoid overfitting your model?
You can use these ways:
- Cross-validation can evaluate the model on multiple data splits.
- Simplification can reduce the tree depth and limit its complex features.
- L1/L2 regularization with Ridge or Lasso.
- Dropout randomly deactivates neurons in neural networks.
- Collect more data and use augmentation techniques too.
11. Data Science Python Interview Question: Use an example to illustrate how you would calculate Euclidean distance in Python.
In a multi-dimensional space, the Euclidean distance measures the straight-line distance between two points. Here’s a code that can help:
from math import sqrt

# Points
point1 = (3, 4)
point2 = (7, 1)

# Euclidean Distance Formula
distance = sqrt((point2[0] - point1[0])**2 + (point2[1] - point1[1])**2)
print("Euclidean Distance:", distance)
12. Explain what algorithm creates the recommendation system on platforms like Amazon and Netflix
Collaborative filtering and content-based filtering are the primary algorithms used. These analyze item similarity and user features to make recommendations. Matrix Factorization uncovers hidden patterns in user-item interactions, while Deep Learning analyzes user behavior. These methods combine to provide accurate, personalized recommendations.
13. Use code to generate numbers that are multiples of 5 from range 1 to 50
# Generate multiples of 5 from 1 to 50
multiples_of_5 = [num for num in range(1, 51) if num % 5 == 0]
print("Multiples of 5:", multiples_of_5)
Output: [5, 10, 15, 20, 25, 30, 35, 40, 45, 50]
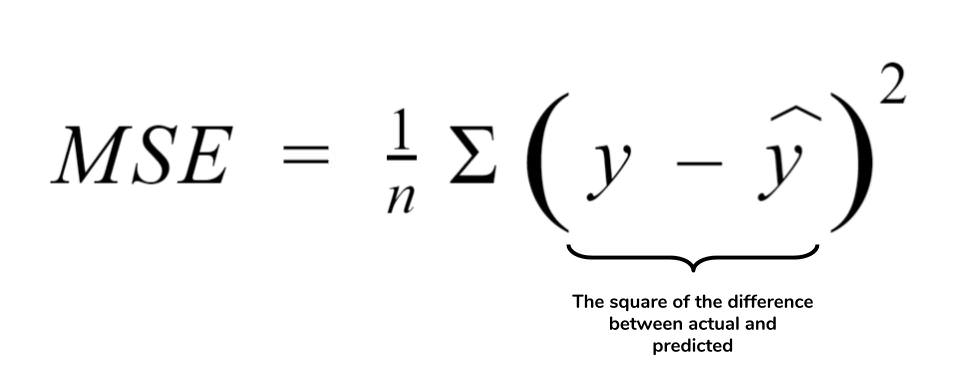
14. What is the formula for RMSE and MSE? What are they used for?
RMSE (Root Mean Squared Error) and MSE (Mean Squared Error) evaluate regression model accuracy by measuring average squared differences between actual and predicted values. Lower values indicate better performance.
i2tutorials.com
Where:
- yi = actual value
- ŷi = predicted value
- P = number of parameters
- N = number of observations
15. What is the difference between Supervised learning vs Unsupervised learning?
| Difference | Supervised learning | Unsupervised learning |
|---|---|---|
| Methods | Uses labeled data | Uses unlabeled data |
| Objective | Predicts outcomes | Groups/reduces data |
| Examples | Linear regression | K-means clustering |
Supervised learning predicts specific outcomes, while unsupervised learning uncovers hidden data structures.
16. How do you calculate eigenvalues and eigenvectors of any 3×3 matrix?
import numpy as np

matrix = np.array([[4, -2, 1], [1, 3, 2], [2, 1, 3]])
eigenvalues, eigenvectors = np.linalg.eig(matrix)

print("Eigenvalues:", eigenvalues)
print("Eigenvectors:", eigenvectors)
17. What is a deployed model? How do you maintain it?
A deployed ML model makes real-time predictions in production. Maintenance includes:
- Performance monitoring
- Regular retraining
- Handling model drift
- A/B testing
- Ensuring scalability and security
18. Write code to calculate statistical measures
import numpy as np

data = [12, 15, 18, 20, 25, 30, 35, 40]

print("Mean:", np.mean(data))
print("Median:", np.median(data))
print("Standard Deviation:", np.std(data))
19. What is an example code to perform k-means clustering?
from sklearn.cluster import KMeans
import matplotlib.pyplot as plt

X, _ = make_blobs(n_samples=300, centers=4, random_state=42)
kmeans = KMeans(n_clusters=4, random_state=42).fit(X)

plt.scatter(X[:, 0], X[:, 1], c=kmeans.labels_, cmap='viridis')
plt.scatter(kmeans.cluster_centers_[:, 0], kmeans.cluster_centers_[:, 1],
            c='red', marker='x', s=200)
plt.title("K-Means Clustering")
plt.show()
20. How are matrices used in linear regressions?
Matrices organize data and simplify calculations in linear regression. For example, predicting salary (Y) from experience (X):
Salary = β₀ + β₁ × Experience
We use matrix operations to calculate β coefficients that minimize prediction error, then use these to make new predictions.
Things to Remember
- Demonstrate Python knowledge with clear examples
- Explain concepts simply but thoroughly
- Relate answers to your project experience
Other Common Questions
- What is transfer learning in deep learning?
- What other programming languages do you know?
- What are Type I and Type II errors?
Jaro Education: Data Science Interview Questions and Answers, Careers and More
With our experience of over 15 years in the education space, we take pride in our accomplishments in the data science space. Through our website, you can access top bachelor’s and master’s courses in data science, computer science and engineering. Moreover, our exclusive work with the top tech and management schools in the country has resulted in industry-relevant data science certification courses that can significantly boost your resume and make data science interview question and answer prep better.
We also offer:
- 1:1 mentorship with experts to understand your career needs and build an education path for you.
- AI-powered free tools such as skill gap analysis to understand what you need to flourish in your career.
- Free learning resources taught by experts.
Final Thoughts
Data science interview questions and answers can prep you for your foray into the data science world. Practice with mentors, colleagues or classmates, and make sure you present yourself with good flow, an even temperament and a curiosity to learn. All the best for your job interviews!

